Live Data Streams Transform How Bettors Manage Wagers Across Cricket, Tennis, and Racing Events
Alex Long · Sep 24, 2026

Live Data Streams Transform How Bettors Manage Wagers Across Cricket, Tennis, and Racing Events
Real-time analytics platforms now deliver live metrics that help enthusiasts track odds shifts, player performance indicators, and track conditions while they place wagers on cricket, tennis, and racing circuits through multiple betting sites and apps. These tools aggregate data from sensors, video feeds, and historical databases, then present it in dashboards that update every few seconds during matches and races. Observers note that bettors often switch between platforms to compare live lines because analytics reveal discrepancies in pricing that appear when new information emerges mid-event.
Cricket Matches and Instant Metric Overlays
During international cricket tournaments in September 2026, analytics packages display ball-by-ball expected value calculations alongside current odds from several operators, allowing users to move stakes when a bowler’s economy rate deviates from model predictions. Data streams pull from pitch maps and player heat maps that update after each delivery, so those following T20 or Test matches receive alerts when run-rate projections change. One study from the Australian Institute of Criminology found that platforms integrating these feeds recorded higher transaction volumes during live overs compared with static pre-match markets.
Tennis Tournaments and Point-Level Decision Support
Tennis analytics operate at an even finer grain because points conclude in seconds rather than minutes. Software layers serve probability estimates for break points, serve speeds, and surface-specific win rates that refresh after every rally. Bettors navigate between apps to lock in or hedge positions when a player’s first-serve percentage drops below the algorithm’s threshold. Researchers at the University of Nevada, Las Vegas documented how such point-by-point modeling correlates with shifts in wagering volume across ATP and WTA events, particularly on hard courts where data variance tends to spike.
Racing Circuits and Pace Analytics Integration
Horse and greyhound racing circuits feed sectional timing data and wind-adjusted pace figures into the same multi-platform environments. Enthusiasts monitor live leaderboards that compare each runner’s split times against historical benchmarks for the distance and track. When analytics flag a horse that has conserved energy better than the field in early sections, users frequently transfer positions to another operator offering adjusted place terms. Industry reports from the European Gaming and Betting Association indicate that real-time sectional overlays have become standard features on racing-focused sites since mid-2025.
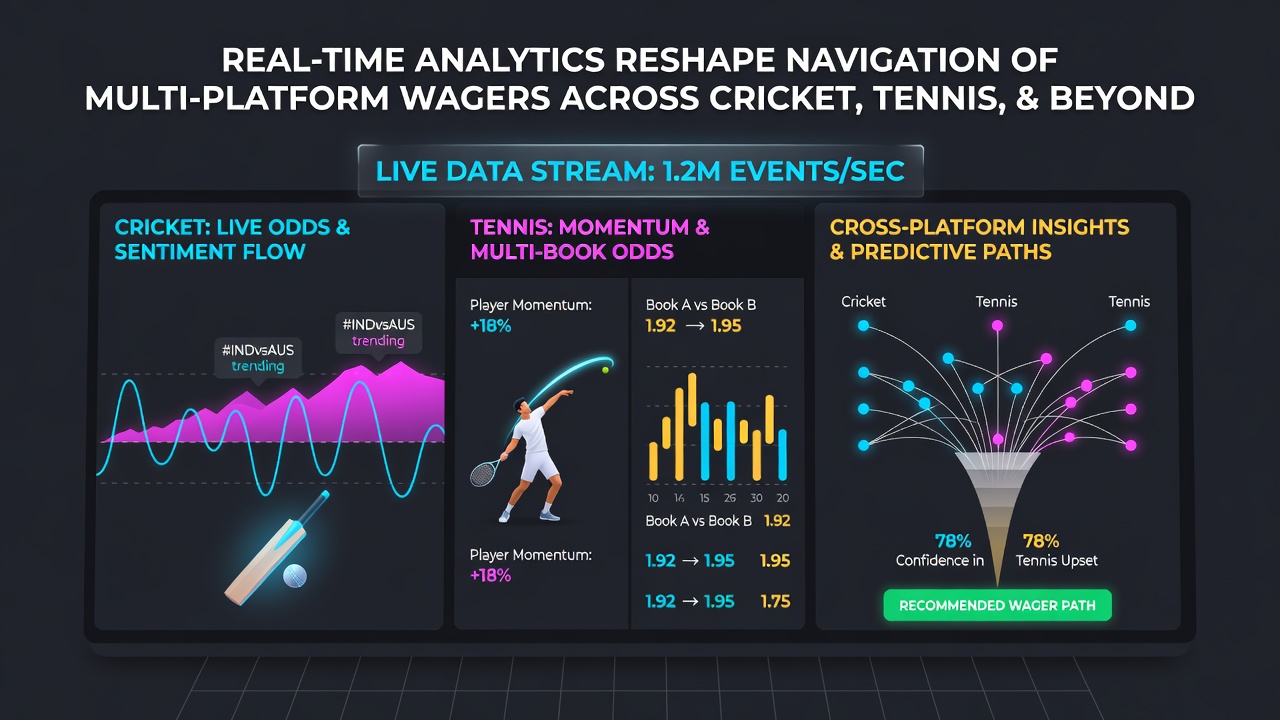
Multi-platform navigation relies on APIs that push unified data sets to several operators simultaneously. Bettors therefore compare implied probabilities across sites without leaving their analytics dashboard. Those who follow cricket, tennis, and racing simultaneously often maintain separate watchlists because each sport generates distinct data velocities. Cricket updates cluster around overs, tennis around points, and racing around furlongs, so timing windows for decisions differ. Platforms that synchronize these feeds reduce the lag between data arrival and odds adjustment.
September 2026 Developments in Cross-Sport Tools
By September 2026 several providers introduced unified interfaces that let users toggle between cricket, tennis, and racing dashboards while maintaining a single account balance across linked operators. These interfaces embed risk-management indicators that flag when live odds diverge from model outputs by more than a set percentage. Regulatory filings in multiple jurisdictions show increased scrutiny of how such tools present information, yet adoption continues because the underlying data sources remain public performance records and timing systems.
Case examples illustrate the pattern. A researcher tracking ATP qualifying matches observed that bettors who consulted real-time serve analytics moved wagers to alternative platforms within 30 seconds of a double-fault spike. Similar behavior appears in racing when sectional data shows a favorite tiring earlier than expected. Cricket markets display the same response when an analytics panel highlights an unexpected change in pitch behavior after the tenth over.
Conclusion
Real-time analytics continue to supply structured data layers that enthusiasts consult when managing wagers across cricket, tennis, and racing on multiple platforms. The systems compile sensor readings, video-derived statistics, and historical comparisons into live displays that update throughout events. As operators refine API connections and regulators review presentation standards, the infrastructure supporting these tools remains central to how participants monitor and adjust positions during live competition.